
In short: This data-driven US defense spending analysis reveals a critical paradox: the budget is approaching $1 trillion not because the force is expanding, but because weapon complexity and bureaucracy are creating diminishing returns.
Estimated reading time: 14 minutes
The Trillion-Dollar Threshold: US Defense Spending Analysis
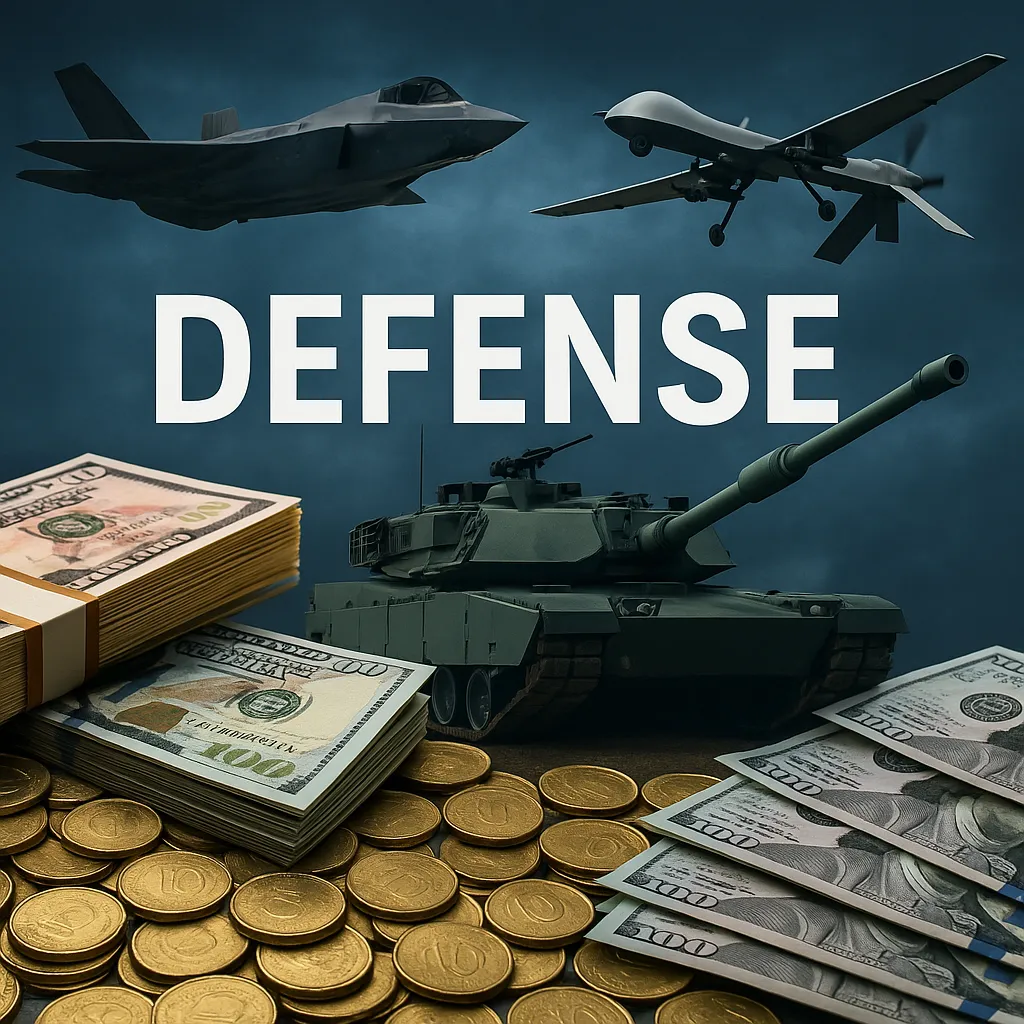
The United States stands at an unprecedented crossroads. The fiscal year 2024 defense budget reached $886 billion, with projections indicating a breach of the trillion-dollar mark soon. To understand this shift, our US defense spending analysis breaks down the structural forces driving costs upward versus the actual combat capability gained.
Estimated reading time: 14 minutes
The Trillion-Dollar Threshold: A New Era of Escalating Costs
The United States stands at an unprecedented crossroads in defense spending. The fiscal year 2024 defense budget reached $886 billion, with projections indicating a breach of the trillion-dollar threshold by 2026–2027. This represents not merely an incremental increase but a fundamental shift in the scale of American military investment.
To understand the magnitude: when adjusted for inflation, the Reagan-era defense peak of 1985 ($456 billion nominal) equates to approximately $1.28 trillion in 2024 dollars. However, that spending represented 6.2% of GDP, while today’s near-trillion-dollar budget constitutes only 3.4% of GDP—suggesting that while absolute spending approaches Cold War peaks, the relative economic burden remains lower.
The Strategic Dilemma: Are we gaining proportionate combat capability for this massive investment, or have we entered a zone of diminishing returns where each additional dollar yields progressively less warfighting power?
This analysis examines the structural forces driving defense costs upward, quantifies the efficiency losses within the system, and proposes evidence-based reforms to restore strategic value.
Understanding the Cost Explosion: Data-Driven Analysis
Phase I: Post-9/11 Surge (2001–2011)
The September 11 attacks triggered the longest sustained defense spending increase since Vietnam. Base defense budgets grew dramatically to support counter-insurgency operations, requiring rapid deployment of MRAP vehicles and a massive expansion of ISR capabilities.
Phase II: Budget Control Act Constraints (2011–2017)
Spending caps reduced DoD budgets, revealing critical vulnerabilities: deferred modernization (F-35 delays), a readiness crisis where few brigades were combat-ready, and a $116 billion facility maintenance backlog.
Phase III: Great-Power Competition Era (2018–Present)
The shift to peer competition with China and Russia has driven the budget to $886 billion (FY2024). The primary cost drivers include:
- Nuclear Modernization: ~$756 billion over 10 years (Columbia-class subs, B-21 Raider, GBSD).
- Hypersonic Weapons: Multi-billion dollar R&D for programs like AGM-183A and LRHW.
- Space Force: ~$30 billion annually for resilient satellite architecture.
- AI & Autonomy: JADC2 and the “Replicator” initiative investments.
The Hidden Cost Disease: Industrial and Bureaucratic Inflation
Case Study 1: The F-35 Cost Paradox
The F-35 program illustrates both success and system dysfunction. While unit costs have dropped to ~$78M, the total lifecycle cost is projected at $1.7 trillion. The sustainment cost per flight hour remains high (~$33,600), and modernization delays (Technology Refresh 3) continue to add billions.
Case Study 2: Naval Shipbuilding Cost Escalation
| Ship Class | Initial Cost (FY dollars) | Current Cost (FY dollars) | Growth Rate |
|---|---|---|---|
| DDG-51 Burke (Flight I vs III) | $950M (1991) | $2.4B (2024) | +153% |
| Virginia-class SSN (Block I vs V) | $2.5B (2004) | $4.3B (2024) | +72% |
| Ford-class CVN (CVN-79) | Reference | $12.4B | -7% (Minimal gain) |
Analysis: Even accounting for inflation, per-unit costs grow 2–3% annually beyond inflation—what economists call “cost disease” in low-productivity sectors.
Quantifying Diminishing Returns: Capability-per-Dollar Decline
Metric 1: Purchasing Power Decline
For every billion dollars spent (adjusted for inflation), the US buys significantly less hardware today than in the Cold War:
- Fighters: 32 aircraft/billion (1985) → 12 aircraft/billion (2024)
- Surface Ships: 0.85 ships/billion (1985) → 0.42 ships/billion (2024)
Metric 2: Force Structure Contraction
Despite a budget approaching $1 trillion, the force is shrinking compared to 1990:
| Metric | 1990 (Cold War End) | 2024 (Current) | Change |
|---|---|---|---|
| Active Duty Personnel | 2.1 million | 1.3 million | -38% |
| Navy Battle Force Ships | 529 | 291 | -45% |
| Fighter Squadrons | 134 | 88 | -34% |
Metric 3: The Software Tax
Modern platforms are software-defined. The F-4 Phantom had 0 lines of code; the F-35 has 8.6 million. Software management now consumes 30–40% of lifecycle costs, a category that barely existed during the Cold War.
Why Diminishing Returns? Structural Explanations
- The Complexity Frontier: Achieving the last 10% of performance (e.g., extreme stealth or Mach 8+ speed) requires exponentially greater investment as physics limits are approached.
- The Bureaucratic Tax: Defense acquisition operates through layers of oversight. Programs now average 11–15 years from concept to fielding.
- The Vendor Oligopoly: Consolidation has left only ~5 dominant primes, reducing competitive pressure on pricing and innovation.
- The Dual-Threat Tax: Planning for both high-tech maritime war (China) and attritional land war (Russia) prevents optimization for a single mission.
Strategic Solutions: Reversing the Cost Curve
Addressing diminishing returns requires systemic reform, not merely spending more:
1. Procurement Transformation
Adopting Middle Tier of Acquisition (MTA) pathways to field prototypes in 2–5 years, and treating software updates as continuous delivery rather than major modifications.
2. Legacy Divestment
Retiring aging, non-combat-coded airframes (like older F-15s) to free up O&M dollars for next-generation systems.
3. Asymmetric Investment
Moving from “few exquisite platforms” to “many good-enough systems” (e.g., Collaborative Combat Aircraft – CCA) to improve cost-exchange ratios.
Conclusion: The Imperative of Efficiency
The United States will almost certainly breach the trillion-dollar defense threshold in the late 2020s. This milestone represents a strategic inflection point.
The evidence indicates a zone of diminishing returns where marginal spending yields progressively less combat capability. Without structural reform—prioritizing procurement agility, industrial competition, and asymmetric technology—the US risks funding a system that spends more to achieve less.
The ultimate question is whether the US defense establishment can reform itself before external shocks force chaotic change.


